Instagram Research · Classical Music Organizations · April 2026
What 52 Orchestras Taught Me About Instagram
I set out to benchmark follower counts against market size, arts vibrancy, and posting habits. The data confirmed something I've always believed — and it changes how you should think about your social media strategy.
A Spearman correlation study of 52 orchestras and opera companies. April 2026.
A note on terminology: "Standalone" refers to orchestras and ensembles with their own dedicated Instagram account. "Parent organization" accounts — such as the Metropolitan Opera — serve a broader institutional audience and are analyzed separately where noted.
Question 01
Does Posting More = More Followers?
Indeed, there is a statistical relationship here, but it's almost entirely driven by large parent-organization accounts. For standalone orchestras, how often you post has little bearing on how many people follow you.
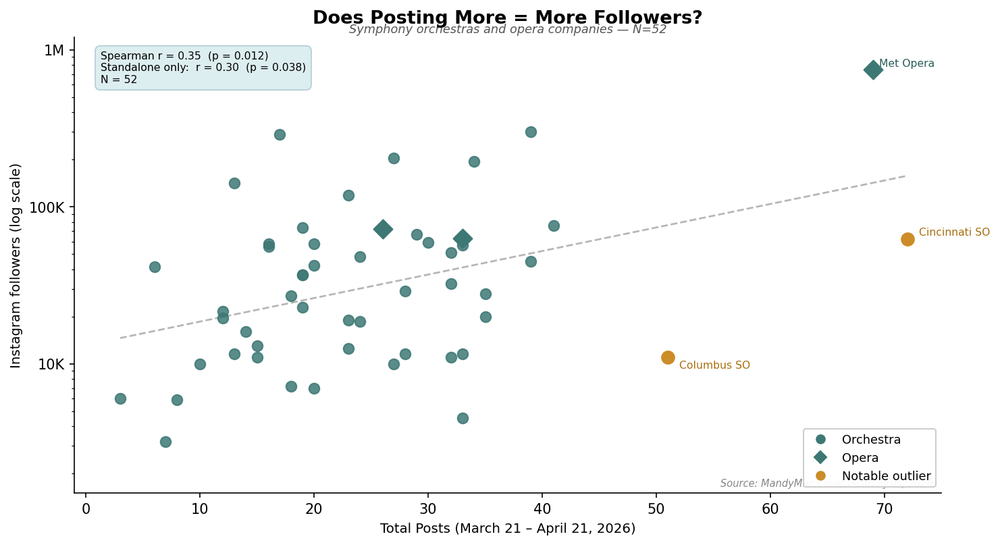
Total posts (Mar 21–Apr 21) vs. followers (Apr 21) · MandyMac Creative analysis, 2026
Milwaukee Symphony posted 28 times in a month and has 11,500 followers. Buffalo Philharmonic posted 14 times — half as often — and has 16,000. More posts, fewer followers.
Posting volume isn't your lever. The correlation disappears when you control for account type. Organizations that post sparingly and strategically often outperform those posting daily. It's not about quantity.
If your social media person is burning out trying to post every day, the data says: stop. Shift that energy toward fewer, higher-quality posts — especially Reels. We'll get to that.
Question 01
Does Posting More = More Followers?
Indeed, there is a statistical relationship here, but it's almost entirely driven by large parent-organization accounts. For standalone orchestras, how often you post has little bearing on how many people follow you.
Total posts (Mar 21–Apr 21) vs. followers (Apr 21) · MandyMac Creative analysis, 2026
Posting volume isn't your lever. The correlation disappears when you control for account type. Organizations that post sparingly and strategically often outperform those posting daily. It's not about quantity.
Milwaukee Symphony posted 28 times in a month and has 11,500 followers. Buffalo Philharmonic posted 14 times — half as often — and has 16,000. More posts, fewer followers.
If your social media person is burning out trying to post every day, the data says: stop. Shift that energy toward fewer, higher-quality posts — especially Reels. We'll get to that.
Question 02
Is It Just About Market Size?
Yes — and no. Metro population is the single strongest predictor of follower count in this entire study. But it explains only part of the picture, and the organizations above and below the trendline tell the more interesting story.
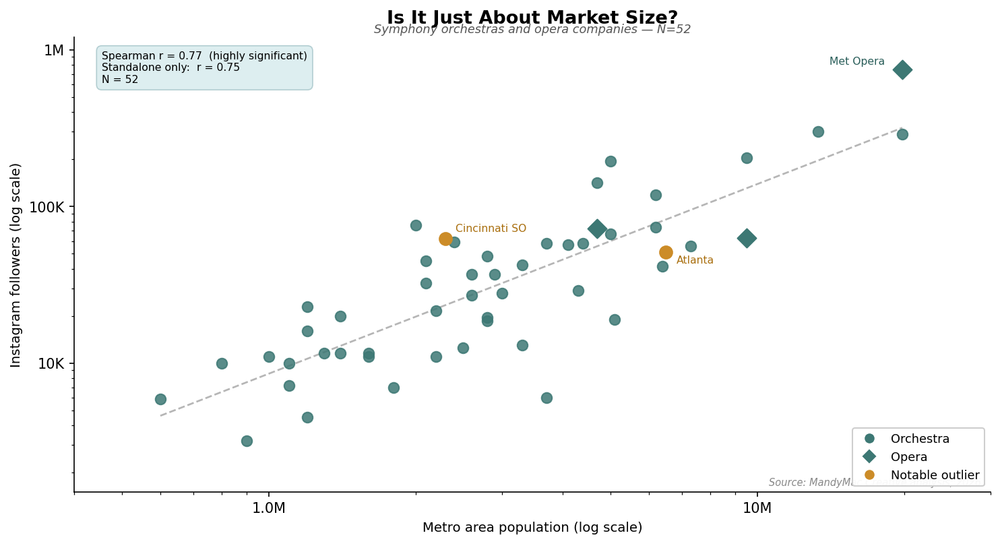
Instagram followers vs. metro area population (log scale) · MandyMac Creative analysis, 2026
Cincinnati Symphony is in a metro of 2.3 million and has 62,500 followers. Atlanta Symphony is in a metro nearly three times larger — 6.5 million — and has 51,000. Market size sets the context. It doesn't set the ceiling.
If you're in a small market, this is context, not an excuse. The organizations beating their market are making intentional choices about what they put on Instagram. That is what this study is about.
All metro populations are MSA or CMA figures — metro statistical areas, not city-proper populations. This makes the comparison apples-to-apples across US and Canadian markets.
Question 02
Is It Just About Market Size?
Yes — and no. Metro population is the single strongest predictor of follower count in this entire study. But it explains only part of the picture, and the organizations above and below the trendline tell the more interesting story.
Instagram followers vs. metro area population (log scale) · MandyMac Creative analysis, 2026
If you're in a small market, this is context, not an excuse. The organizations beating their market are making intentional choices about what they put on Instagram. That is what this study is about.
Cincinnati Symphony is in a metro of 2.3 million and has 62,500 followers. Atlanta Symphony is in a metro nearly three times larger — and has 51,000. Market size sets the context. It doesn't set the ceiling.
All metro populations are MSA or CMA figures — metro statistical areas, not city-proper populations. This makes the comparison apples-to-apples across US and Canadian markets.
Question 03
Does a Vibrant Arts Ecosystem Help?
As you would expect, the data shows that a vibrant arts ecosystem helps, but it's not destiny.
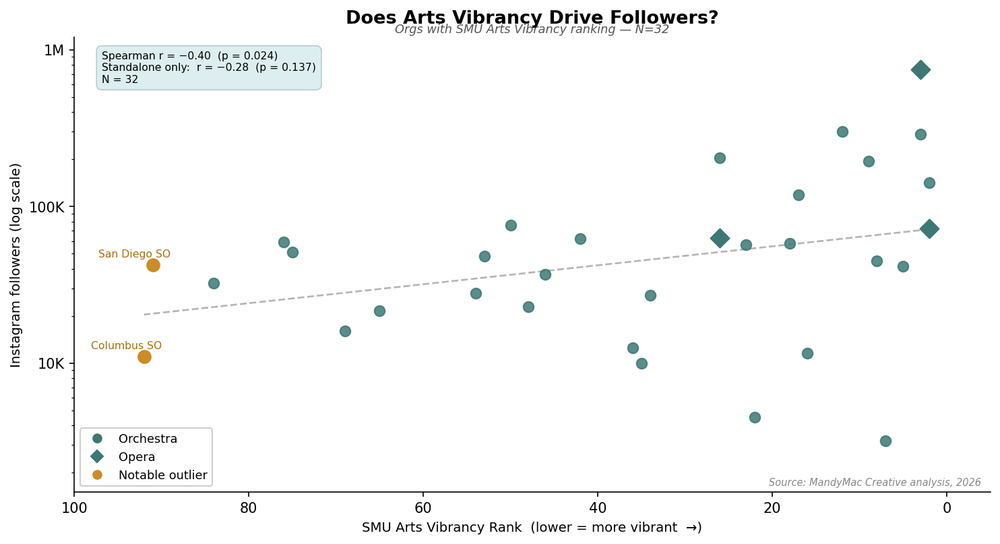
SMU Arts Vibrancy Rank (2025 index, lower = more vibrant) vs. followers · MandyMac Creative analysis, 2026
San Diego Symphony ranks 91st for arts vibrancy and has 42,500 followers. Columbus Symphony ranks 92nd — nearly identical — and has 11,000. Same vibrancy. Wildly different results.
The arts vibrancy of your city gives you a tailwind — but not a guarantee. The organizations exceeding expectations in their markets are making intentional strategic choices about what they put on Instagram. Strategy beats geography.
Rankings from the SMU DataArts 2025 index, published January 2026. Covers US metro areas only — Canadian organizations are excluded from this analysis. N = 32 for this chart.
Question 03
Does a Vibrant Arts Ecosystem Help?
As you would expect, the data shows that a vibrant arts ecosystem helps, but it's not destiny.
SMU Arts Vibrancy Rank (2025 index, lower = more vibrant) vs. followers · MandyMac Creative analysis, 2026
The arts vibrancy of your city gives you a tailwind — but not a guarantee. The organizations exceeding expectations are making intentional strategic choices about what they put on Instagram. Strategy beats geography.
San Diego Symphony ranks 91st for arts vibrancy and has 42,500 followers. Columbus Symphony ranks 92nd — nearly identical — and has 11,000. Same vibrancy. Wildly different results.
Rankings from the SMU DataArts 2025 index, published January 2026. Covers US metro areas only — Canadian organizations are excluded from this analysis. N = 32 for this chart.
So far, so structural
Market size and arts vibrancy are real factors — but your team doesn't control either of them.
The next two findings are different. They're about choices your social media team makes every single week. And the data has something very specific to say about them.
So far, so structural
Market size and arts vibrancy are real factors — but your team doesn't control either of them.
The next two findings are different. They're about choices your social media team makes every single week. And the data has something very specific to say about them.
Question 04
Do Static Post Types Hold You Back?
Single-image posts show a significant negative relationship with follower count. Carousels show no relationship at all. The data doesn't just say Reels help — it says singles specifically hurt.

% single-image posts and % carousels vs. followers (Apr 21) · MandyMac Creative analysis, 2026
Hartford Symphony posts 70% single images — 4,500 followers. Winnipeg Symphony posts 70% singles — 10,000 followers. Toledo Symphony posts 100% static, zero Reels — 5,900 followers.
Single images are often used to post content that is essentially PR — concert announcements, headshots, award notices. This kind of content preaches to the choir. It reaches people who already follow you, assumes they already care, and does almost nothing to find new audiences. Singles maintain. They don't grow.
Carousels are neutral. They show no significant positive or negative relationship with follower count. They can be excellent for engagement with your existing audience — but like singles, they're not a growth engine.
Question 04
Do Static Post Types Hold You Back?
Single-image posts show a significant negative relationship with follower count. Carousels show no relationship at all. The data doesn't just say Reels help — it says singles specifically hurt.
% single-image posts and % carousels vs. followers (Apr 21) · MandyMac Creative analysis, 2026
Single images are often used to post content that is essentially PR — concert announcements, headshots, award notices. This kind of content preaches to the choir. It reaches people who already follow you and does almost nothing to find new audiences. Singles maintain. They don't grow.
Carousels are neutral. They show no significant positive or negative relationship with follower count. They can be excellent for engagement with your existing audience — but like singles, they're not a growth engine.
Hartford Symphony posts 70% single images — 4,500 followers. Winnipeg Symphony posts 70% singles — 10,000 followers. Toledo Symphony posts 100% static, zero Reels — 5,900 followers.
Question 05
Are Reels Really the Way to Grow an Account?
Of everything tested — market size, arts vibrancy, posting volume, content type — the proportion of posts that are Reels is the variable most directly associated with audience growth, and the one your social media team decides every week.
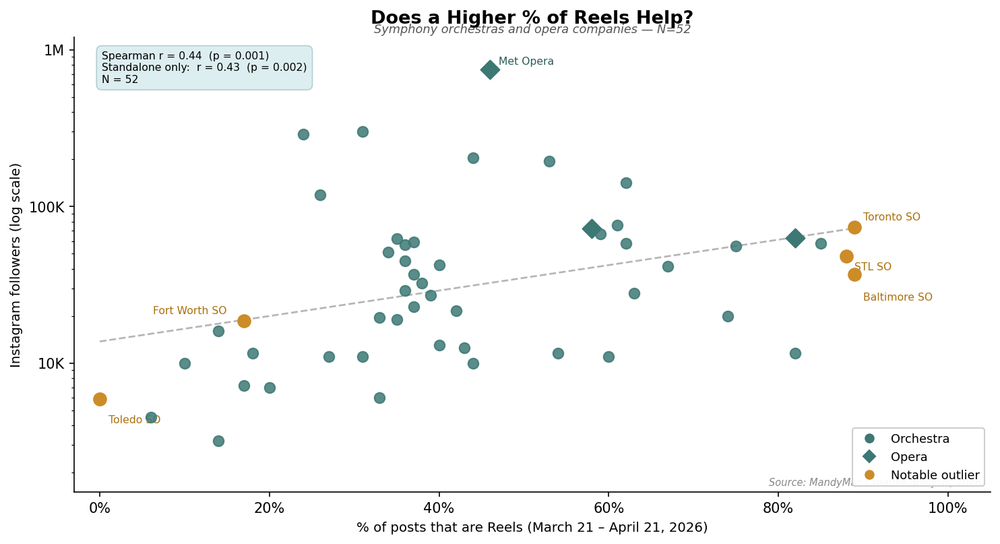
% of posts that are Reels (Mar 21–Apr 21) vs. followers (Apr 21) · MandyMac Creative analysis, 2026
Toronto Symphony: 89% Reels, 74,000 followers. St. Louis Symphony: 88% Reels, 48,000 followers. Baltimore Symphony: 89% Reels, 37,000 followers. Fort Worth Symphony: 17% Reels — 18,500 followers.
You need to post smarter. Toronto Symphony posted just 19 times in a month — and 89% of those were Reels. They have more followers than organizations posting 4× as often. Volume isn't the variable. Format is.
If 40% of your posts became Reels — without increasing your total volume at all — the data suggests you'd outperform the average organization in this study. That is a very achievable shift. And it's one I help teams make.
Reels are served to non-followers through Explore and the Reels feed. They are Instagram's primary discovery mechanism. Every Reel is a chance to find someone new. Every static post is mostly just talking to people who already know you.
Question 05
Are Reels Really the Way to Grow an Account?
Of everything tested — market size, arts vibrancy, posting volume, content type — the proportion of posts that are Reels is the variable most directly associated with audience growth, and the one your social media team decides every week.
% of posts that are Reels (Mar 21–Apr 21) vs. followers (Apr 21) · MandyMac Creative analysis, 2026
You need to post smarter. Toronto Symphony posted just 19 times in a month — and 89% of those were Reels. They have more followers than organizations posting 4× as often. Volume isn't the variable. Format is.
If 40% of your posts became Reels — without increasing your total volume at all — the data suggests you'd outperform the average organization in this study. That is a very achievable shift. And it's one I help teams make.
Reels are served to non-followers through Explore and the Reels feed. They are Instagram's primary discovery mechanism. Every Reel is a chance to find someone new. Every static post is mostly just talking to people who already know you.
Toronto Symphony: 89% Reels, 74,000 followers. St. Louis Symphony: 88% Reels, 48,000 followers. Baltimore Symphony: 89% Reels, 37,000 followers. Fort Worth Symphony: 17% Reels — 18,500 followers.
Take this with you
Instagram is the greatest opportunity orchestras have right now.
I believe this deeply — and this data backs it up. The barrier isn't budget or market size or staff capacity. It's strategy. And strategy is learnable.
Download This Study as a PDF →Download the full study — including all charts, methodology, and a complete data table listing all 52 organizations with their follower counts, posting patterns, and market data. Find your own orchestra in the numbers. Free, no strings attached beyond your email address.
Get the PDF →Every orchestra is different. Market size, team capacity, budget, and content mix all factor into your specific strategy. I offer customized analysis and training for social media teams at classical music organizations.
Get in touch →Amanda McIntosh is a former orchestral clarinetist and social media strategist specializing in classical music organizations. This study was conducted in April 2026 using publicly available Instagram data and US Census / Statistics Canada metro population figures.
Take this with you
Instagram is the greatest opportunity orchestras have right now.
I believe this deeply — and this data backs it up. The barrier isn't budget or market size or staff capacity. It's strategy. And strategy is learnable.
Download the full study — including all charts, methodology, and a complete data table listing all 52 organizations with their follower counts, posting patterns, and market data. Free, no strings attached beyond your email address.
Get the PDF →Every orchestra is different. Market size, team capacity, budget, and content mix all factor into your specific strategy. I offer customized analysis and training for social media teams at classical music organizations.
Get in touch →Amanda McIntosh is a former orchestral clarinetist and social media strategist specializing in classical music organizations. This study was conducted in April 2026 using publicly available Instagram data and US Census / Statistics Canada metro population figures.