Instagram Research · Classical Music Organizations · 2025
What Actually Grows an Orchestra's Instagram Following?
A data analysis of 50+ orchestras and opera companies — testing four common assumptions to find the one strategy that actually works.
Instagram Research · Classical Music Organizations · 2025
What Actually Grows an Orchestra's Instagram Following?
A data analysis of 50+ orchestras and opera companies — testing four common assumptions to find the one strategy that actually works.
Question 01
Does Posting More Mean More Followers?
No significant relationship — posting volume alone doesn't drive audience growth. Organizations posting constantly can still plateau, while others post sparingly and soar.
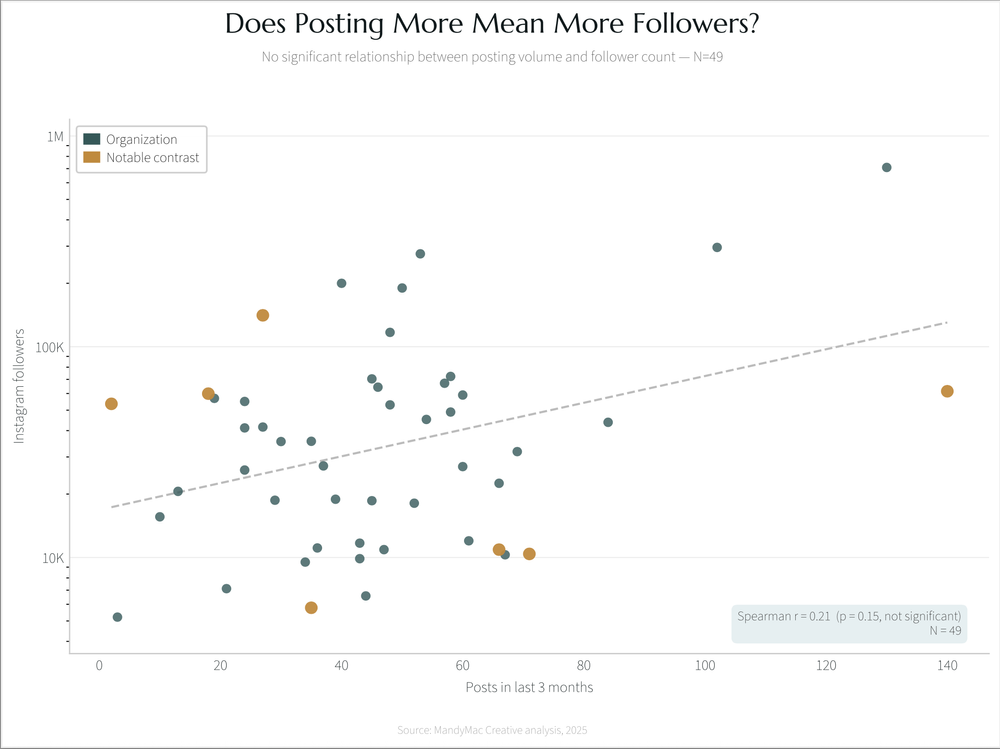
Posts in last 3 months vs. total followers · MandyMac Creative analysis, 2025
Cincinnati Symphony posted 140 times in 3 months and has 61,500 followers. Houston Symphony posted just twice and has 53,600. More effort, nearly identical results.
| Organization | Posts (3 mo.) | Followers |
|---|---|---|
| Metropolitan Opera | 130 | 709,000 |
| Los Angeles Philharmonic | 102 | 296,000 |
| NY Philharmonic | 53 | 276,000 |
| Chicago Symphony | 40 | 200,000 |
| Boston Symphony | 50 | 190,000 |
| SF Symphony | 27 | 141,000 |
| Philadelphia Orchestra | 48 | 117,000 |
| Cleveland Orchestra | 58 | 72,300 |
| Toronto Symphony | 45 | 70,400 |
| SF Opera | 57 | 67,100 |
| Dallas Symphony | 46 | 64,300 |
| Cincinnati Symphony | 140 | 61,500 |
| Lyric Opera Chicago | 18 | 59,900 |
| Seattle Symphony | 60 | 59,000 |
| Detroit Symphony | 19 | 56,900 |
| Minnesota Orchestra | 24 | 55,000 |
| Houston Symphony | 2 | 53,600 |
| Pittsburgh Symphony | 48 | 53,000 |
| Atlanta Symphony | 58 | 49,000 |
| St. Louis Symphony | 54 | 45,200 |
| Nashville Symphony | 84 | 43,800 |
| San Diego Symphony | 27 | 41,600 |
| National Symphony DC | 24 | 41,200 |
| Baltimore Symphony | 35 | 35,600 |
| Vancouver Symphony | 30 | 35,500 |
| Indianapolis Symphony | 69 | 31,800 |
| OSM Montreal | 37 | 27,200 |
| Colorado Symphony | 60 | 27,000 |
| Oregon Symphony | 24 | 26,000 |
| Utah Symphony | 66 | 22,500 |
| Kansas City Symphony | 13 | 20,600 |
| Charlotte Symphony | 39 | 18,900 |
| Louisville Orchestra | 29 | 18,700 |
| Phoenix Symphony | 45 | 18,600 |
| Fort Worth Symphony | 52 | 18,100 |
| Buffalo Philharmonic | 10 | 15,600 |
| New Jersey Symphony | 61 | 12,000 |
| Florida Orchestra | 43 | 11,700 |
| Milwaukee Symphony | 36 | 11,100 |
| NC Symphony | 66 | 10,900 |
| Hawaii Symphony | 47 | 10,900 |
| Jacksonville Symphony | 71 | 10,400 |
| Columbus Symphony | 67 | 10,300 |
| Rochester Philharmonic | 43 | 9,875 |
| Winnipeg Symphony | 34 | 9,510 |
| Grand Rapids Symphony | 21 | 7,117 |
| Virginia Symphony | 44 | 6,573 |
| Toledo Symphony | 35 | 5,776 |
| St. Paul Chamber Orchestra | 3 | 5,214 |
Question 01
Does Posting More Mean More Followers?
No significant relationship — posting volume alone doesn't drive audience growth. Organizations posting constantly can still plateau, while others post sparingly and soar.
Posts in last 3 months vs. total followers · MandyMac Creative analysis, 2025
Cincinnati Symphony posted 140 times in 3 months and has 61,500 followers. Houston Symphony posted just twice and has 53,600. More effort, nearly identical results.
| Organization | Posts (3 mo.) | Followers |
|---|---|---|
| Metropolitan Opera | 130 | 709,000 |
| Los Angeles Philharmonic | 102 | 296,000 |
| NY Philharmonic | 53 | 276,000 |
| Chicago Symphony | 40 | 200,000 |
| Boston Symphony | 50 | 190,000 |
| SF Symphony | 27 | 141,000 |
| Philadelphia Orchestra | 48 | 117,000 |
| Cleveland Orchestra | 58 | 72,300 |
| Toronto Symphony | 45 | 70,400 |
| SF Opera | 57 | 67,100 |
| Dallas Symphony | 46 | 64,300 |
| Cincinnati Symphony | 140 | 61,500 |
| Lyric Opera Chicago | 18 | 59,900 |
| Seattle Symphony | 60 | 59,000 |
| Detroit Symphony | 19 | 56,900 |
| Minnesota Orchestra | 24 | 55,000 |
| Houston Symphony | 2 | 53,600 |
| Pittsburgh Symphony | 48 | 53,000 |
| Atlanta Symphony | 58 | 49,000 |
| St. Louis Symphony | 54 | 45,200 |
| Nashville Symphony | 84 | 43,800 |
| San Diego Symphony | 27 | 41,600 |
| National Symphony DC | 24 | 41,200 |
| Baltimore Symphony | 35 | 35,600 |
| Vancouver Symphony | 30 | 35,500 |
| Indianapolis Symphony | 69 | 31,800 |
| OSM Montreal | 37 | 27,200 |
| Colorado Symphony | 60 | 27,000 |
| Oregon Symphony | 24 | 26,000 |
| Utah Symphony | 66 | 22,500 |
| Kansas City Symphony | 13 | 20,600 |
| Charlotte Symphony | 39 | 18,900 |
| Louisville Orchestra | 29 | 18,700 |
| Phoenix Symphony | 45 | 18,600 |
| Fort Worth Symphony | 52 | 18,100 |
| Buffalo Philharmonic | 10 | 15,600 |
| New Jersey Symphony | 61 | 12,000 |
| Florida Orchestra | 43 | 11,700 |
| Milwaukee Symphony | 36 | 11,100 |
| NC Symphony | 66 | 10,900 |
| Hawaii Symphony | 47 | 10,900 |
| Jacksonville Symphony | 71 | 10,400 |
| Columbus Symphony | 67 | 10,300 |
| Rochester Philharmonic | 43 | 9,875 |
| Winnipeg Symphony | 34 | 9,510 |
| Grand Rapids Symphony | 21 | 7,117 |
| Virginia Symphony | 44 | 6,573 |
| Toledo Symphony | 35 | 5,776 |
| St. Paul Chamber Orchestra | 3 | 5,214 |
Question 02
Is It Just About Market Size?
Market size is the single strongest structural predictor of follower count — but it explains only part of the picture. The organizations above and below the trendline tell the more interesting story.

Instagram followers vs. metro area population · MandyMac Creative analysis, 2025
SF Symphony (metro: 827K) has 141,000 followers — more than St. Louis Symphony in a market of 3.1M (45,200 followers). Cincinnati (metro: 309K) has 61,500. City size matters, but it does not determine outcomes.
| Organization | Followers | Metro Population |
|---|---|---|
| Chicago Symphony | 200,000 | 9,400,000 |
| Boston Symphony | 190,000 | 4,400,000 |
| SF Symphony | 141,000 | 827,526 |
| Philadelphia Orchestra | 117,000 | 6,330,000 |
| Cleveland Orchestra | 72,300 | 372,624 |
| Toronto Symphony | 70,400 | 2,800,000 |
| SF Opera | 67,100 | 827,526 |
| Dallas Symphony | 64,300 | 1,305,370 |
| Cincinnati Symphony | 61,500 | 309,313 |
| Lyric Opera Chicago | 59,900 | 9,400,000 |
| Seattle Symphony | 59,000 | 4,150,000 |
| Detroit Symphony | 56,900 | 645,000 |
| Minnesota Orchestra | 55,000 | 429,954 |
| Houston Symphony | 53,600 | 2,304,000 |
| Pittsburgh Symphony | 53,000 | 303,000 |
| Atlanta Symphony | 49,000 | 520,000 |
| St. Louis Symphony | 45,200 | 3,100,000 |
| Nashville Symphony | 43,800 | 715,884 |
| San Diego Symphony | 41,600 | 3,336,000 |
| National Symphony DC | 41,200 | 827,526 |
| Baltimore Symphony | 35,600 | 585,706 |
| Vancouver Symphony | 35,500 | 2,700,000 |
| Indianapolis Symphony | 31,800 | 888,000 |
| OSM Montreal | 27,200 | 1,800,000 |
| Colorado Symphony | 27,000 | 715,522 |
| Oregon Symphony | 26,000 | 652,503 |
| Utah Symphony | 22,500 | 200,000 |
| Kansas City Symphony | 20,600 | 508,000 |
| Charlotte Symphony | 18,900 | 879,709 |
| Louisville Orchestra | 18,700 | 782,969 |
| Phoenix Symphony | 18,600 | 1,600,000 |
| Fort Worth Symphony | 18,100 | 1,000,000 |
| Buffalo Philharmonic | 15,600 | 278,349 |
| New Jersey Symphony | 12,000 | 47,000 |
| Florida Orchestra | 11,700 | 267,000 |
| Milwaukee Symphony | 11,100 | 577,222 |
| NC Symphony | 10,900 | 1,600,000 |
| Hawaii Symphony | 10,900 | 344,000 |
| Jacksonville Symphony | 10,400 | 1,000,000 |
| Columbus Symphony | 10,300 | 905,708 |
| Rochester Philharmonic | 9,875 | 211,000 |
| Winnipeg Symphony | 9,510 | 749,607 |
| Grand Rapids Symphony | 7,117 | 200,000 |
| Virginia Symphony | 6,573 | 238,000 |
| Toledo Symphony | 5,776 | 287,000 |
| St. Paul Chamber Orchestra | 5,214 | 311,527 |
| Hartford Symphony | 4,203 | 124,000 |
Question 02
Is It Just About Market Size?
Market size is the single strongest structural predictor of follower count — but it explains only part of the picture. The organizations above and below the trendline tell the more interesting story.
Instagram followers vs. metro area population · MandyMac Creative analysis, 2025
SF Symphony (metro: 827K) has 141,000 followers — more than St. Louis Symphony in a market of 3.1M. Cincinnati (metro: 309K) has 61,500. City size matters, but it does not determine outcomes.
| Organization | Followers | Metro Pop. |
|---|---|---|
| Chicago Symphony | 200,000 | 9,400,000 |
| Boston Symphony | 190,000 | 4,400,000 |
| SF Symphony | 141,000 | 827,526 |
| Philadelphia Orchestra | 117,000 | 6,330,000 |
| Cleveland Orchestra | 72,300 | 372,624 |
| Toronto Symphony | 70,400 | 2,800,000 |
| SF Opera | 67,100 | 827,526 |
| Dallas Symphony | 64,300 | 1,305,370 |
| Cincinnati Symphony | 61,500 | 309,313 |
| Lyric Opera Chicago | 59,900 | 9,400,000 |
| Seattle Symphony | 59,000 | 4,150,000 |
| Detroit Symphony | 56,900 | 645,000 |
| Minnesota Orchestra | 55,000 | 429,954 |
| Houston Symphony | 53,600 | 2,304,000 |
| Pittsburgh Symphony | 53,000 | 303,000 |
| Atlanta Symphony | 49,000 | 520,000 |
| St. Louis Symphony | 45,200 | 3,100,000 |
| Nashville Symphony | 43,800 | 715,884 |
| San Diego Symphony | 41,600 | 3,336,000 |
| National Symphony DC | 41,200 | 827,526 |
| Baltimore Symphony | 35,600 | 585,706 |
| Vancouver Symphony | 35,500 | 2,700,000 |
| Indianapolis Symphony | 31,800 | 888,000 |
| OSM Montreal | 27,200 | 1,800,000 |
| Colorado Symphony | 27,000 | 715,522 |
| Oregon Symphony | 26,000 | 652,503 |
| Utah Symphony | 22,500 | 200,000 |
| Kansas City Symphony | 20,600 | 508,000 |
| Charlotte Symphony | 18,900 | 879,709 |
| Louisville Orchestra | 18,700 | 782,969 |
| Phoenix Symphony | 18,600 | 1,600,000 |
| Fort Worth Symphony | 18,100 | 1,000,000 |
| Buffalo Philharmonic | 15,600 | 278,349 |
| New Jersey Symphony | 12,000 | 47,000 |
| Florida Orchestra | 11,700 | 267,000 |
| Milwaukee Symphony | 11,100 | 577,222 |
| NC Symphony | 10,900 | 1,600,000 |
| Hawaii Symphony | 10,900 | 344,000 |
| Jacksonville Symphony | 10,400 | 1,000,000 |
| Columbus Symphony | 10,300 | 905,708 |
| Rochester Philharmonic | 9,875 | 211,000 |
| Winnipeg Symphony | 9,510 | 749,607 |
| Grand Rapids Symphony | 7,117 | 200,000 |
| Virginia Symphony | 6,573 | 238,000 |
| Toledo Symphony | 5,776 | 287,000 |
| St. Paul Chamber Orchestra | 5,214 | 311,527 |
| Hartford Symphony | 4,203 | 124,000 |
Question 03
Does a Vibrant Arts Ecosystem Predict Instagram Reach?
There's a real relationship here — but it's not the whole story, and it's not something your team controls. Being in a vibrant arts city gives you a tailwind, not a guarantee.

SMU Arts Vibrancy Rank (1 = most vibrant) vs. followers · N = 32 · MandyMac Creative, 2025
Hartford Symphony sits in vibrancy rank 22 — a highly active arts market — yet has only 4,203 followers. San Diego Symphony ranks 91st and has 41,600. Your city is context, not destiny.
| Organization | Followers | SMU Vibrancy Rank |
|---|---|---|
| Metropolitan Opera | 709,000 | 3 |
| Los Angeles Philharmonic | 296,000 | 12 |
| NY Philharmonic | 276,000 | 2 |
| Chicago Symphony | 200,000 | 26 |
| Boston Symphony | 190,000 | 9 |
| SF Symphony | 141,000 | 2 |
| Philadelphia Orchestra | 117,000 | 17 |
| Cleveland Orchestra | 72,300 | 50 |
| SF Opera | 67,100 | 2 |
| Cincinnati Symphony | 61,500 | 42 |
| Lyric Opera Chicago | 59,900 | 26 |
| Seattle Symphony | 59,000 | 23 |
| Minnesota Orchestra | 55,000 | 18 |
| Pittsburgh Symphony | 53,000 | 76 |
| Atlanta Symphony | 49,000 | 75 |
| St. Louis Symphony | 45,200 | 53 |
| Nashville Symphony | 43,800 | 8 |
| San Diego Symphony | 41,600 | 91 |
| National Symphony DC | 41,200 | 5 |
| Baltimore Symphony | 35,600 | 46 |
| Vancouver Symphony | 35,500 | 34 |
| Indianapolis Symphony | 31,800 | 84 |
| Colorado Symphony | 27,000 | 54 |
| Oregon Symphony | 26,000 | 34 |
| Utah Symphony | 22,500 | 48 |
| Kansas City Symphony | 20,600 | 65 |
| Buffalo Philharmonic | 15,600 | 69 |
| New Jersey Symphony | 12,000 | 36 |
| Columbus Symphony | 10,300 | 92 |
| Rochester Philharmonic | 9,875 | 35 |
| Hartford Symphony | 4,203 | 22 |
| New Haven Symphony | 3,035 | 7 |
Question 03
Does a Vibrant Arts Ecosystem Predict Instagram Reach?
There's a real relationship here — but it's not the whole story, and it's not something your team controls. Being in a vibrant arts city gives you a tailwind, not a guarantee.
SMU Arts Vibrancy Rank (1 = most vibrant) vs. followers · N = 32 · MandyMac Creative, 2025
Hartford Symphony sits in vibrancy rank 22 — a highly active arts market — yet has only 4,203 followers. San Diego Symphony ranks 91st and has 41,600. Your city is context, not destiny.
| Organization | Followers | Vibrancy Rank |
|---|---|---|
| Metropolitan Opera | 709,000 | 3 |
| Los Angeles Philharmonic | 296,000 | 12 |
| NY Philharmonic | 276,000 | 2 |
| Chicago Symphony | 200,000 | 26 |
| Boston Symphony | 190,000 | 9 |
| SF Symphony | 141,000 | 2 |
| Philadelphia Orchestra | 117,000 | 17 |
| Cleveland Orchestra | 72,300 | 50 |
| SF Opera | 67,100 | 2 |
| Cincinnati Symphony | 61,500 | 42 |
| Lyric Opera Chicago | 59,900 | 26 |
| Seattle Symphony | 59,000 | 23 |
| Minnesota Orchestra | 55,000 | 18 |
| Pittsburgh Symphony | 53,000 | 76 |
| Atlanta Symphony | 49,000 | 75 |
| St. Louis Symphony | 45,200 | 53 |
| Nashville Symphony | 43,800 | 8 |
| San Diego Symphony | 41,600 | 91 |
| National Symphony DC | 41,200 | 5 |
| Baltimore Symphony | 35,600 | 46 |
| Vancouver Symphony | 35,500 | 34 |
| Indianapolis Symphony | 31,800 | 84 |
| Colorado Symphony | 27,000 | 54 |
| Oregon Symphony | 26,000 | 34 |
| Utah Symphony | 22,500 | 48 |
| Kansas City Symphony | 20,600 | 65 |
| Buffalo Philharmonic | 15,600 | 69 |
| New Jersey Symphony | 12,000 | 36 |
| Columbus Symphony | 10,300 | 92 |
| Rochester Philharmonic | 9,875 | 35 |
| Hartford Symphony | 4,203 | 22 |
| New Haven Symphony | 3,035 | 7 |
So if it's not posting volume, market size, or arts ecosystem — what can your team actually control?
It turns out the answer shows up clearly in the data. And it's not about working harder. It's about choosing the right format.
So if it's not posting volume, market size, or arts ecosystem — what can your team actually control?
It turns out the answer shows up clearly in the data. And it's not about working harder. It's about choosing the right format.
Question 04
Static Post Types and Follower Count
Single images actively work against you. Carousels are neutral. If your feed leans on static content, the data suggests it may be holding your growth back.

% single images and % carousels vs. followers · MandyMac Creative analysis, 2025
Every percentage point you shift away from single images and toward Reels is a meaningful change. Hartford Symphony posts 70% single images — 4,203 followers. Toledo Symphony posts 100% static images, 0 Reels — 5,776 followers. The pattern holds consistently across the dataset.
Question 04
Static Post Types and Follower Count
Single images actively work against you. Carousels are neutral. If your feed leans on static content, the data suggests it may be holding your growth back.
% single images and % carousels vs. followers · MandyMac Creative analysis, 2025
Every percentage point you shift away from single images and toward Reels is a meaningful change. Hartford Symphony posts 70% single images — 4,203 followers. Toledo posts 100% static, 0 Reels — 5,776 followers.
Question 05 · The Answer
Reels and Follower Count: The Variable That Actually Moves the Needle
Among all the variables examined — market size, vibrancy, posting volume, content type — the proportion of posts that are Reels is the one your team controls directly, and it is among the most predictive.
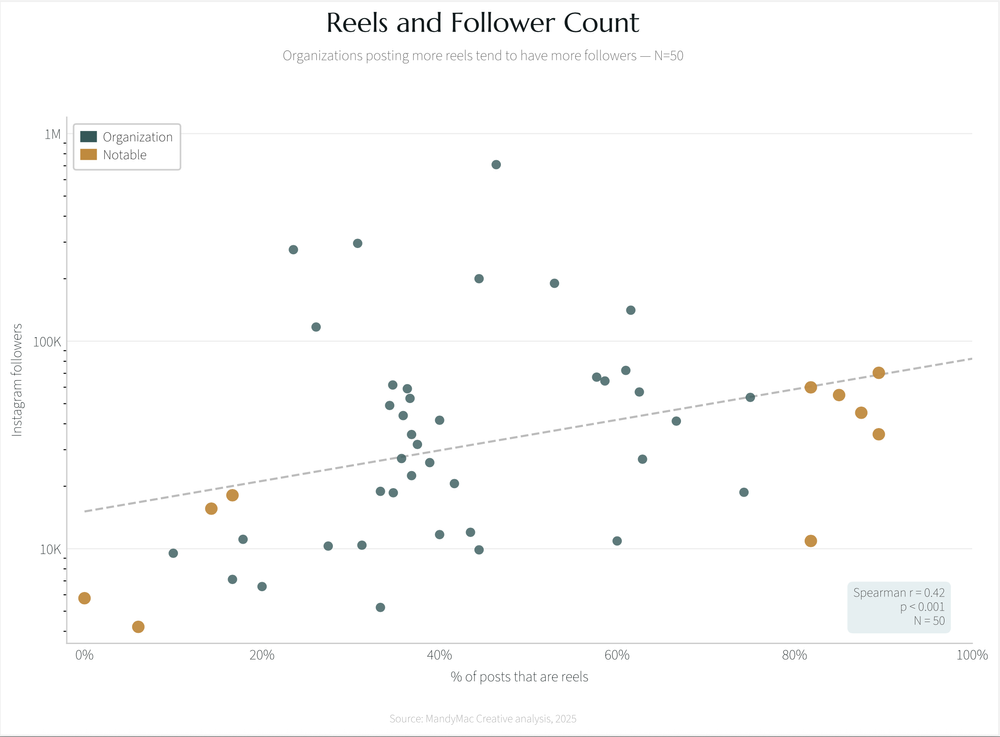
% of posts that are Reels vs. total followers · N = 50 · MandyMac Creative, 2025
Organizations at 0–20% Reels tend to have lower follower counts. Organizations at 60–90% Reels consistently outperform. Toronto Symphony (89% Reels) has 70,400 followers. Toledo Symphony (0% Reels) has 5,776.
You don't need to post every day. You need to make fewer, higher-quality Reels — and let the algorithm do the rest. Reels reach non-followers. Static images largely do not.
If even 40% of your posts became Reels — without increasing your total volume — the data suggests you'd outperform the average organization in this study.
| Organization | Followers | Reels | % Reels | Single Images | % Singles | Carousels | % Carousels | Total Posts |
|---|---|---|---|---|---|---|---|---|
| Toronto Symphony | 70,400 | 17 | 89% | 2 | 11% | 0 | 0% | 19 |
| Baltimore Symphony | 35,600 | 17 | 89% | 1 | 5% | 1 | 5% | 19 |
| St. Louis Symphony | 45,200 | 21 | 88% | 1 | 4% | 2 | 8% | 24 |
| Minnesota Orchestra | 55,000 | 17 | 85% | 0 | 0% | 3 | 15% | 20 |
| Lyric Opera Chicago | 59,900 | 27 | 82% | 1 | 3% | 5 | 15% | 33 |
| NC Symphony | 10,900 | 27 | 82% | 4 | 12% | 2 | 6% | 33 |
| Houston Symphony | 53,600 | 12 | 75% | 1 | 6% | 3 | 19% | 16 |
| Louisville Orchestra | 18,700 | 26 | 74% | 0 | 0% | 9 | 26% | 35 |
| National Symphony DC | 41,200 | 4 | 67% | 2 | 33% | 0 | 0% | 6 |
| Colorado Symphony | 27,000 | 22 | 63% | 11 | 31% | 2 | 6% | 35 |
| SF Symphony | 141,000 | 8 | 62% | 2 | 15% | 3 | 23% | 13 |
| Detroit Symphony | 56,900 | 10 | 62% | 1 | 6% | 5 | 31% | 16 |
| Cleveland Orchestra | 72,300 | 25 | 61% | 3 | 7% | 13 | 32% | 41 |
| Hawaii Symphony | 10,900 | 9 | 60% | 1 | 7% | 5 | 33% | 15 |
| Dallas Symphony | 64,300 | 17 | 59% | 1 | 3% | 11 | 38% | 29 |
| SF Opera | 67,100 | 15 | 58% | 2 | 8% | 9 | 35% | 26 |
| Boston Symphony | 190,000 | 18 | 53% | 4 | 12% | 12 | 35% | 34 |
| Metropolitan Opera | 709,000 | 32 | 46% | 20 | 29% | 17 | 25% | 69 |
| Chicago Symphony | 200,000 | 12 | 44% | 0 | 0% | 15 | 56% | 27 |
| Rochester Philharmonic | 9,875 | 12 | 44% | 2 | 7% | 13 | 48% | 27 |
| New Jersey Symphony | 12,000 | 10 | 43% | 7 | 30% | 6 | 26% | 23 |
| Kansas City Symphony | 20,600 | 5 | 42% | 2 | 17% | 5 | 42% | 12 |
| San Diego Symphony | 41,600 | 8 | 40% | 2 | 10% | 10 | 50% | 20 |
| Florida Orchestra | 11,700 | 6 | 40% | 4 | 27% | 5 | 33% | 15 |
| Oregon Symphony | 26,000 | 7 | 39% | 3 | 17% | 8 | 44% | 18 |
| Indianapolis Symphony | 31,800 | 12 | 38% | 12 | 38% | 8 | 25% | 32 |
| Pittsburgh Symphony | 53,000 | 11 | 37% | 5 | 17% | 14 | 47% | 30 |
| Vancouver Symphony | 35,500 | 7 | 37% | 12 | 63% | 0 | 0% | 19 |
| Utah Symphony | 22,500 | 7 | 37% | 5 | 26% | 7 | 37% | 19 |
| Seattle Symphony | 59,000 | 12 | 36% | 16 | 48% | 5 | 15% | 33 |
| Nashville Symphony | 43,800 | 14 | 36% | 16 | 41% | 9 | 23% | 39 |
| OSM Montreal | 27,200 | 10 | 36% | 11 | 39% | 7 | 25% | 28 |
| Cincinnati Symphony | 61,500 | 25 | 35% | 23 | 32% | 24 | 33% | 72 |
| Phoenix Symphony | 18,600 | 8 | 35% | 9 | 39% | 6 | 26% | 23 |
| Atlanta Symphony | 49,000 | 11 | 34% | 10 | 31% | 11 | 34% | 32 |
| Charlotte Symphony | 18,900 | 4 | 33% | 3 | 25% | 5 | 42% | 12 |
| St. Paul Chamber Orchestra | 5,214 | 1 | 33% | 0 | 0% | 2 | 67% | 3 |
| Los Angeles Philharmonic | 296,000 | 12 | 31% | 15 | 38% | 12 | 31% | 39 |
| Jacksonville Symphony | 10,400 | 10 | 31% | 6 | 19% | 16 | 50% | 32 |
| Columbus Symphony | 10,300 | 14 | 27% | 11 | 22% | 26 | 51% | 51 |
| Philadelphia Orchestra | 117,000 | 6 | 26% | 4 | 17% | 13 | 57% | 23 |
| NY Philharmonic | 276,000 | 4 | 24% | 3 | 18% | 10 | 59% | 17 |
| Virginia Symphony | 6,573 | 4 | 20% | 7 | 35% | 9 | 45% | 20 |
| Milwaukee Symphony | 11,100 | 5 | 18% | 11 | 39% | 12 | 43% | 28 |
| Fort Worth Symphony | 18,100 | 4 | 17% | 5 | 21% | 15 | 62% | 24 |
| Grand Rapids Symphony | 7,117 | 3 | 17% | 11 | 61% | 4 | 22% | 18 |
| Buffalo Philharmonic | 15,600 | 2 | 14% | 7 | 50% | 5 | 36% | 14 |
| Winnipeg Symphony | 9,510 | 1 | 10% | 7 | 70% | 2 | 20% | 10 |
| Hartford Symphony | 4,203 | 2 | 6% | 23 | 70% | 8 | 24% | 33 |
| Toledo Symphony | 5,776 | 0 | 0% | 8 | 100% | 0 | 0% | 8 |
Question 05 · The Answer
Reels and Follower Count: The Variable That Actually Moves the Needle
Among all the variables examined, the proportion of posts that are Reels is the one your team controls directly — and it is among the most predictive.
% of posts that are Reels vs. total followers · N = 50 · MandyMac Creative, 2025
Organizations at 0–20% Reels tend to have lower follower counts. Organizations at 60–90% Reels consistently outperform. Toronto Symphony (89% Reels) has 70,400 followers. Toledo Symphony (0% Reels) has 5,776.
Reels reach non-followers. Static images largely do not. Shifting your content mix toward Reels is the variable this data most directly supports as a driver of audience growth.
| Organization | Followers | Reels | % Reels | Singles | % Singles | Carousels | % Car. | Total |
|---|---|---|---|---|---|---|---|---|
| Toronto Symphony | 70,400 | 17 | 89% | 2 | 11% | 0 | 0% | 19 |
| Baltimore Symphony | 35,600 | 17 | 89% | 1 | 5% | 1 | 5% | 19 |
| St. Louis Symphony | 45,200 | 21 | 88% | 1 | 4% | 2 | 8% | 24 |
| Minnesota Orchestra | 55,000 | 17 | 85% | 0 | 0% | 3 | 15% | 20 |
| Lyric Opera Chicago | 59,900 | 27 | 82% | 1 | 3% | 5 | 15% | 33 |
| NC Symphony | 10,900 | 27 | 82% | 4 | 12% | 2 | 6% | 33 |
| Houston Symphony | 53,600 | 12 | 75% | 1 | 6% | 3 | 19% | 16 |
| Louisville Orchestra | 18,700 | 26 | 74% | 0 | 0% | 9 | 26% | 35 |
| National Symphony DC | 41,200 | 4 | 67% | 2 | 33% | 0 | 0% | 6 |
| Colorado Symphony | 27,000 | 22 | 63% | 11 | 31% | 2 | 6% | 35 |
| SF Symphony | 141,000 | 8 | 62% | 2 | 15% | 3 | 23% | 13 |
| Detroit Symphony | 56,900 | 10 | 62% | 1 | 6% | 5 | 31% | 16 |
| Cleveland Orchestra | 72,300 | 25 | 61% | 3 | 7% | 13 | 32% | 41 |
| Hawaii Symphony | 10,900 | 9 | 60% | 1 | 7% | 5 | 33% | 15 |
| Dallas Symphony | 64,300 | 17 | 59% | 1 | 3% | 11 | 38% | 29 |
| SF Opera | 67,100 | 15 | 58% | 2 | 8% | 9 | 35% | 26 |
| Boston Symphony | 190,000 | 18 | 53% | 4 | 12% | 12 | 35% | 34 |
| Metropolitan Opera | 709,000 | 32 | 46% | 20 | 29% | 17 | 25% | 69 |
| Chicago Symphony | 200,000 | 12 | 44% | 0 | 0% | 15 | 56% | 27 |
| Rochester Philharmonic | 9,875 | 12 | 44% | 2 | 7% | 13 | 48% | 27 |
| New Jersey Symphony | 12,000 | 10 | 43% | 7 | 30% | 6 | 26% | 23 |
| Kansas City Symphony | 20,600 | 5 | 42% | 2 | 17% | 5 | 42% | 12 |
| San Diego Symphony | 41,600 | 8 | 40% | 2 | 10% | 10 | 50% | 20 |
| Florida Orchestra | 11,700 | 6 | 40% | 4 | 27% | 5 | 33% | 15 |
| Oregon Symphony | 26,000 | 7 | 39% | 3 | 17% | 8 | 44% | 18 |
| Indianapolis Symphony | 31,800 | 12 | 38% | 12 | 38% | 8 | 25% | 32 |
| Pittsburgh Symphony | 53,000 | 11 | 37% | 5 | 17% | 14 | 47% | 30 |
| Vancouver Symphony | 35,500 | 7 | 37% | 12 | 63% | 0 | 0% | 19 |
| Utah Symphony | 22,500 | 7 | 37% | 5 | 26% | 7 | 37% | 19 |
| Seattle Symphony | 59,000 | 12 | 36% | 16 | 48% | 5 | 15% | 33 |
| Nashville Symphony | 43,800 | 14 | 36% | 16 | 41% | 9 | 23% | 39 |
| OSM Montreal | 27,200 | 10 | 36% | 11 | 39% | 7 | 25% | 28 |
| Cincinnati Symphony | 61,500 | 25 | 35% | 23 | 32% | 24 | 33% | 72 |
| Phoenix Symphony | 18,600 | 8 | 35% | 9 | 39% | 6 | 26% | 23 |
| Atlanta Symphony | 49,000 | 11 | 34% | 10 | 31% | 11 | 34% | 32 |
| Charlotte Symphony | 18,900 | 4 | 33% | 3 | 25% | 5 | 42% | 12 |
| St. Paul Chamber Orchestra | 5,214 | 1 | 33% | 0 | 0% | 2 | 67% | 3 |
| Los Angeles Philharmonic | 296,000 | 12 | 31% | 15 | 38% | 12 | 31% | 39 |
| Jacksonville Symphony | 10,400 | 10 | 31% | 6 | 19% | 16 | 50% | 32 |
| Columbus Symphony | 10,300 | 14 | 27% | 11 | 22% | 26 | 51% | 51 |
| Philadelphia Orchestra | 117,000 | 6 | 26% | 4 | 17% | 13 | 57% | 23 |
| NY Philharmonic | 276,000 | 4 | 24% | 3 | 18% | 10 | 59% | 17 |
| Virginia Symphony | 6,573 | 4 | 20% | 7 | 35% | 9 | 45% | 20 |
| Milwaukee Symphony | 11,100 | 5 | 18% | 11 | 39% | 12 | 43% | 28 |
| Fort Worth Symphony | 18,100 | 4 | 17% | 5 | 21% | 15 | 62% | 24 |
| Grand Rapids Symphony | 7,117 | 3 | 17% | 11 | 61% | 4 | 22% | 18 |
| Buffalo Philharmonic | 15,600 | 2 | 14% | 7 | 50% | 5 | 36% | 14 |
| Winnipeg Symphony | 9,510 | 1 | 10% | 7 | 70% | 2 | 20% | 10 |
| Hartford Symphony | 4,203 | 2 | 6% | 23 | 70% | 8 | 24% | 33 |
| Toledo Symphony | 5,776 | 0 | 0% | 8 | 100% | 0 | 0% | 8 |
Ready to grow smarter?
Do More With Less — and Actually Grow Your Audience
The organizations winning on Instagram aren't working harder. They're making strategic choices about what they put on the platform. I help classical music organizations build that strategy — rooted in data, built around your team's capacity.
Let's Work TogetherReady to grow smarter?
Do More With Less — and Actually Grow Your Audience
The organizations winning on Instagram aren't working harder. They're making strategic choices about what goes on the platform. I can help you build that strategy.
Let's Work Together